With the constant fundamental changes within the Cryptocurrency world, volatility is to be expected. And using only technical analysis to make conclusions about price movement seems unwise. But it can give us useful insights into the psychology of the markets, and SushiSwap is no exception.
—
SushiSwap (SUSHI) is trading just above a very important horizontal support area. It’s crucial that the price stays above this support in order for the bullish structure to remain intact.
SushiSwap had been decreasing under a descending resistance line since May 18, after it reached a high of $22.50. The line rejected the price multiple times, most recently on Dec 30.
That rejection is still ongoing and has led to a low of $6.30 on Jan 8.
In order for the trend to be considered bullish, SUSHI has to maintain prices above the $6.40 area. This is a very crucial area that has acted as support since May 2021.
While SUSHI decreased below it at the beginning of December (red circle), it has returned to it once more and could be in the process of validating it as support.
Current reading
Technical indicators in the daily time frame are mixed.
The MACD, which is created by short and long-term moving averages (MA), is currently at 0. This means that the short-term MA is moving at the same speed as the long-term one.
Similarly, the RSI is right at the 50-line. The RSI is a momentum indicator, and movements above/below this line can be seen as signs of a bullish trend.

The two-hour chart is a bit more bullish since both the RSI and MACD have generated considerable bullish divergences. This is an occurrence that often precedes bullish trends.
The main resistance is found at $8.75. A breakout above this level would also mean a breakout from the long-term descending resistance line. This would confirm that even the longer-term trend is bullish.

SUSHI wave count
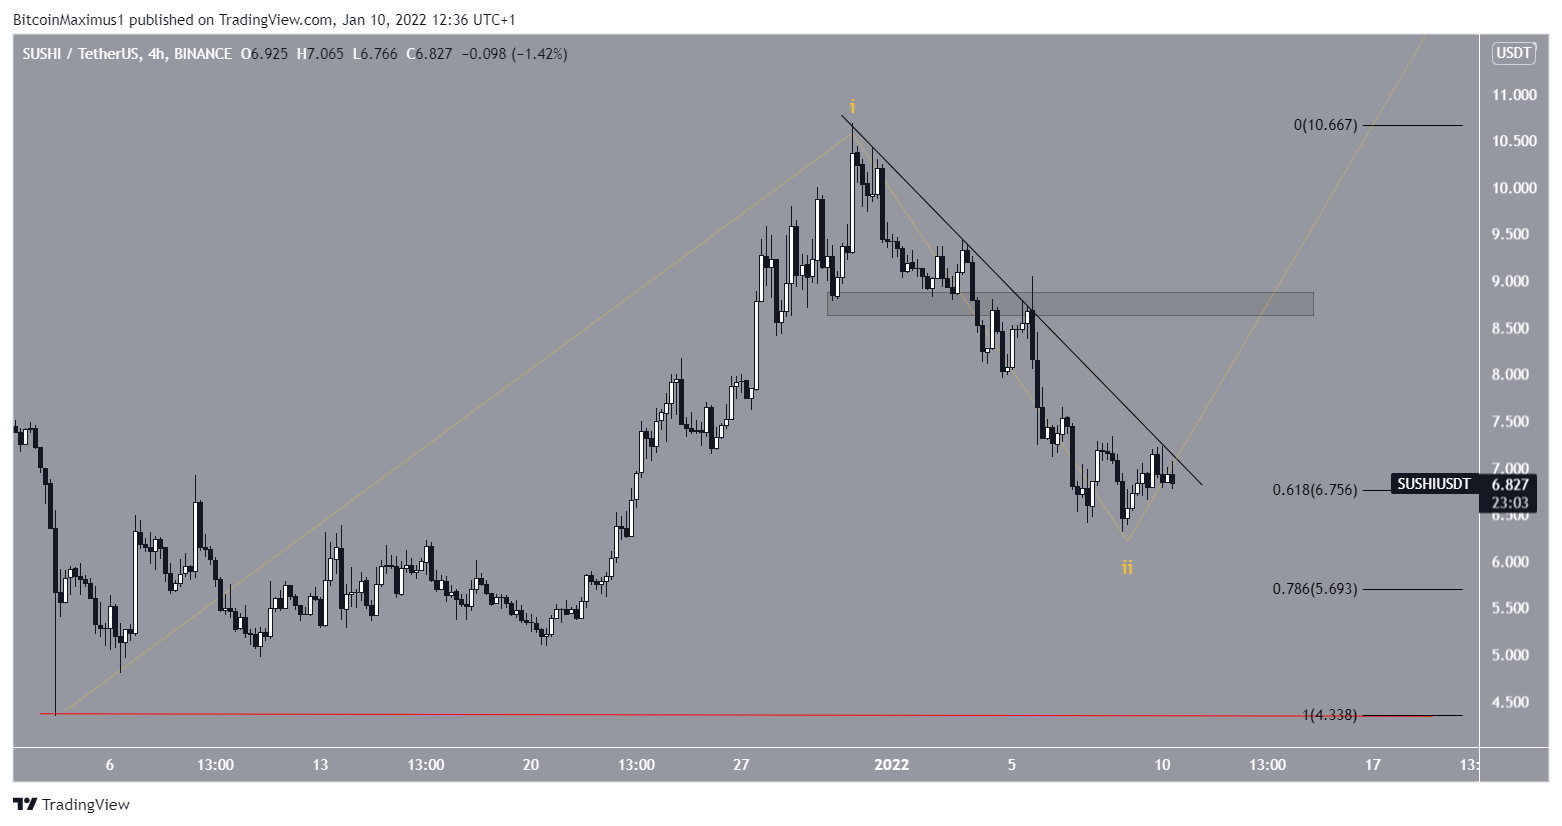
Cryptocurrency trader @TheTradingHubb tweeted a SUSHI chart, stating that it has potentially begun a new bullish impulse.

SUSHI is currently trading just above the 0.618 Fib retracement support level at $6.67 and there is support all the way down to the 0.786 level at $5.70. In order for the bullish scenario to remain valid, SUSHI has to find support near the current level and create a higher low. This would likely lead to the continuation of the upward movement.
A breakdown below the December 2021 lows (red line) would invalidate this wave count and indicate that SUSHI is probably heading lower.
If it follows the long-term wave count, SushiSwap could still move well into a new all-time high price range.


